Capabilities that are hard to replace
ASML builds the EUV lithography machines in the Netherlands. ZEISS makes the precision optical system in Germany. imec trials manufacturing processes in Belgium alongside industry.
Lateral Space Research · 2026
Intelligence, made real.
Where Europe actually stands in the artificial intelligence value chain: from electricity and semiconductors through to models, applications and the processes in which the technology produces economic results.
Photo © visit.brussels / Jean-Paul Remy
The question
An essential part of the most advanced chips is manufactured using machines built in the Netherlands. Yet most of the AI-specialised chips, the cloud and the frontier models used by European firms are designed or controlled outside the continent.
The report distinguishes the steps where Europe holds technologies that are hard to replace, those where it competes, and those where it depends on a handful of external suppliers.
The position, step by step
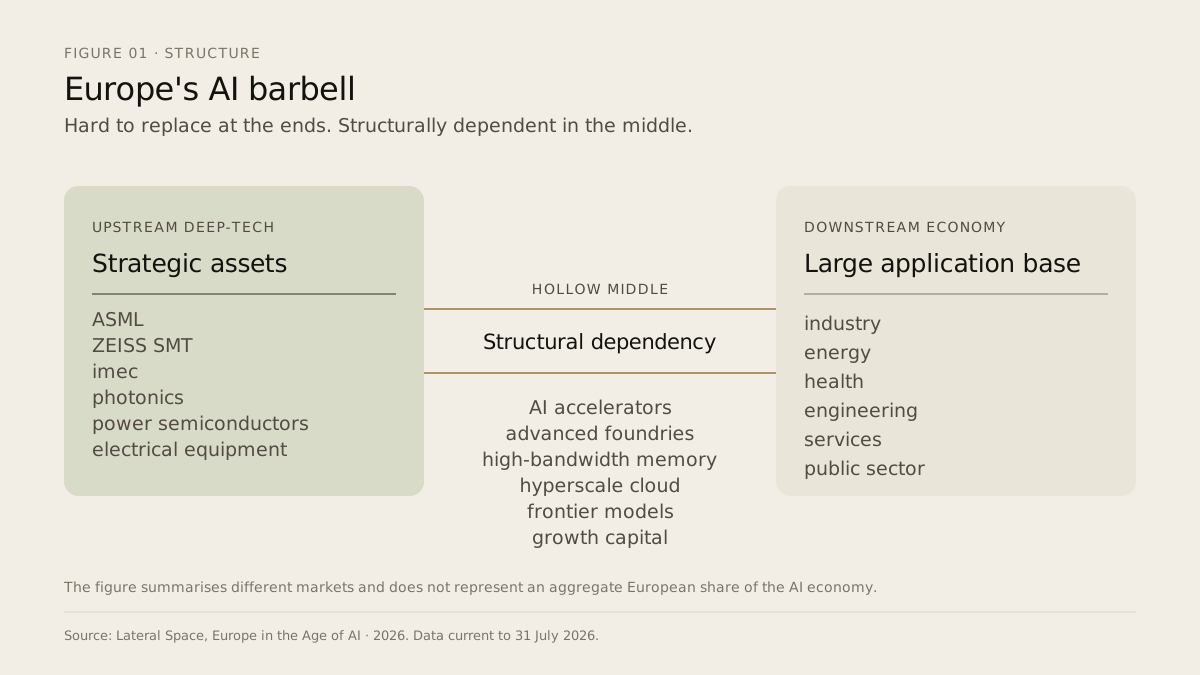
Europe's position is not one position: it changes along the value chain. Read from top to bottom, what emerges is the shape of a barbell.
Lithography
1st company worldwide
ASML, in the Netherlands, builds the EUV machines used to produce the most advanced chips. ZEISS optics, processes proven with imec.
Strong
Manufacturing
20% by 2030
European target share of world semiconductor production set by the Chips Act. The starting point is around 10%.
Dependent
Cloud
~70% of the world market
Sits with three US groups. European providers are at around 15%.
Dependent
Models
1 generalist lab
Mistral is Europe's leading lab: present in technical comparisons, not yet at the very top.
Emerging
Capital
$14.2bn in 2025
Private AI investment across Europe's three largest markets, against $285.9bn in the United States.
Dependent
Adoption
20% of firms
Used AI in 2025, up from 8% in 2023. Among large firms the figure is 55%, among SMEs 19%.
Competitive
Industrial base
€2,400bn value added
European manufacturing generates around 14% of EU GDP and over 30 million jobs. It is where AI can be applied to productive uses.
Strong
The scale
Sources for each figure are given in the report. This is a qualitative assessment, not a score.
The European position
Hard-to-replace technologies upstream, a large industrial economy downstream, dependencies in the middle steps.
Scroll the figure sideways
Europe's barbell
The figure summarises different markets and does not represent an aggregate European share of the AI economy.
Source Lateral Space, from the sources listed in the report
| Step | Position | What it covers |
|---|---|---|
| Upstream | Strong | ASML; ZEISS; imec; photonics; power semiconductors; electrical equipment |
| In the middle | Dependent | AI chips; advanced manufacturing; high-bandwidth memory; global cloud; generalist models; growth capital |
| Downstream | Strong | Manufacturing; energy; automotive; pharmaceuticals; engineering; finance; aerospace; public services |
CSV: data/core/00_europes_ai_barbell.csv (the 2026 report redraws this figure: three upstream organisations, six dependencies, eight downstream sectors — the report text takes precedence over the CSV) · Download data and sources
The value chain
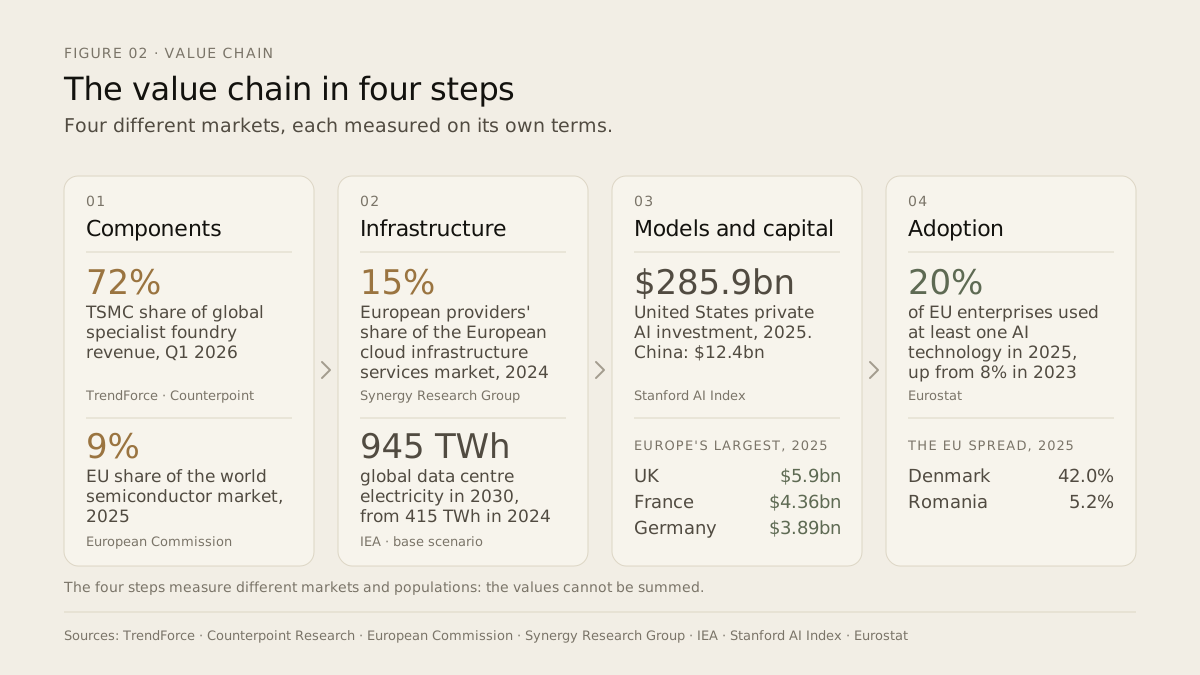
Follow AI from the machines that print the chips to the moment it changes how a company works. One number for each step.
01
72%
of world pure-play foundry revenue goes to a single company: TSMC.
Europe builds the machines that make the chips, but not the chips.
TrendForce / Counterpoint · Q1 2026
02
15%
of Europe's own cloud market is served by European providers.
It was 29% in 2017. Three US groups hold about 70%.
Synergy Research Group · 2024
03
$285.9bn
of private AI investment went to the United States in 2025.
The three largest European markets together raised $14.2bn.
Stanford AI Index · 2025
04
20%
of European enterprises used at least one AI technology in 2025.
It was 8% in 2023. Large firms 55%, SMEs 19%.
Eurostat · 2025
The four steps measure different markets and populations: the values cannot be summed.
Scroll the figure sideways
The value chain in four steps
The four steps measure different markets and populations: the values cannot be summed.
Source TrendForce / Counterpoint; European Commission; Synergy Research Group; IEA; Stanford AI Index; Eurostat
| Step | Figure | What it measures | Source |
|---|---|---|---|
| Components | 72% | Share of world pure-play foundry revenue attributed to TSMC, Q1 2026 | TrendForce / Counterpoint |
| Components | 9% | EU share of the world semiconductor market, 2025 | European Commission |
| Infrastructure | 15% | Share of the European cloud infrastructure services market held by European providers, 2024 | Synergy Research Group |
| Infrastructure | 415 → 945 TWh | Global data centre electricity: 2024 estimate and 2030 base scenario | International Energy Agency |
| Models and capital | $285.9bn / $12.4bn | Private AI investment in 2025, United States and China | Stanford AI Index |
| Models and capital | $5.9 / 4.4 / 3.9bn | Private AI investment in 2025: United Kingdom, France, Germany | Stanford AI Index |
| Adoption | 20% | European enterprises using at least one AI technology in 2025 (8% in 2023) | Eurostat |
| Adoption | 42% → 5.2% | Distance between Denmark and Romania, the two extremes recorded in the EU | Eurostat |
CSV: data/core/ (four datasets, see DATA_DICTIONARY.csv) · Download data and sources
Chapters
The report has 29 chapters. These six are the fastest way in.
 Without available, stable electric power there is no computing at scale.
01
Without available, stable electric power there is no computing at scale.
01
 No latest-generation chip exists without passing through this chain.
02
No latest-generation chip exists without passing through this chain.
02
 Three groups control roughly two thirds of the world cloud market.
03
Three groups control roughly two thirds of the world cloud market.
03
 Europe trains some of the best researchers in the world and has credible companies in the layer that connects…
04
Europe trains some of the best researchers in the world and has credible companies in the layer that connects…
04
 In two years the use of AI in European enterprises has more than doubled: from 8% in 2023 to 20% in 2025.
05
In two years the use of AI in European enterprises has more than doubled: from 8% in 2023 to 20% in 2025.
05
 Physical AI means systems where a model does not only produce text or images but controls or guides an object…
06
Physical AI means systems where a model does not only produce text or images but controls or guides an object…
06
Deep dive
Each one opens with the argument, the numbers behind it and the figure you can download and reuse.
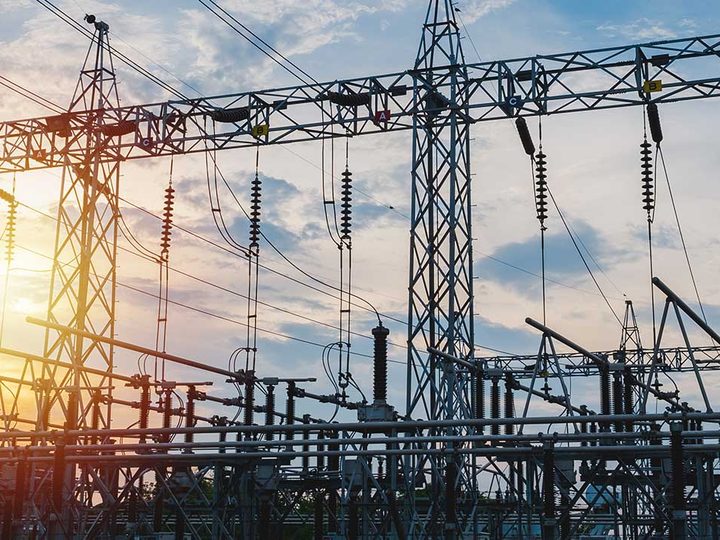
Without available, stable electric power there is no computing at scale. It is the first physical constraint, not a rhetorical premise. Global data centre electricity: 415 TWh in 2024, 945 TWh in the IEA base scenario for 2030.
Schneider Electric, Siemens, ABB, Legrand and Prysmian supply electrical systems, cables, automation and cooling.
415 TWh
Global data centre electricity, 2024
IEA
945 TWh
IEA base scenario for 2030
IEA
5
European groups powering the racks: Schneider, Siemens, ABB, Legrand, Prysmian
Report ch. 07
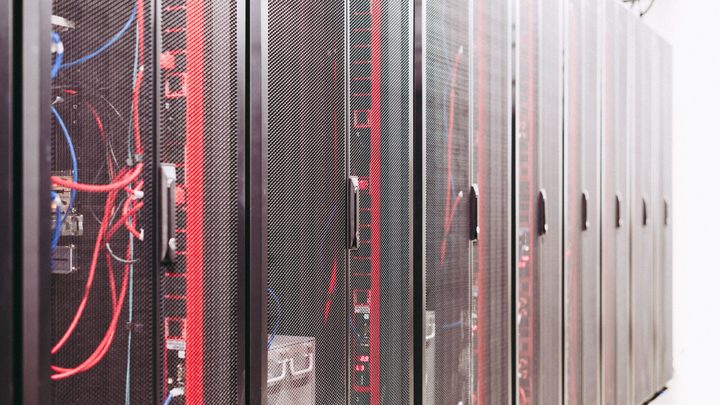
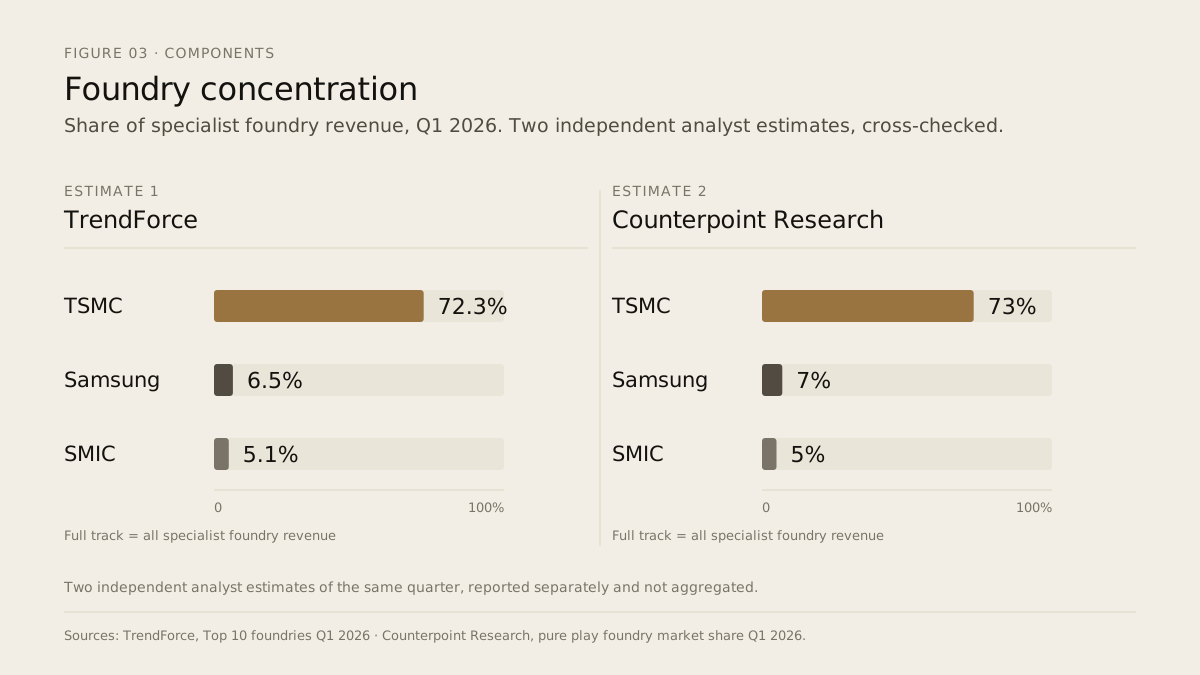
No latest-generation chip exists without passing through this chain. It is the stretch where the dependency runs in Europe's favour: replacing these capabilities would take years and skills that do not exist elsewhere today.
ASML builds the EUV lithography machine in the Netherlands; ZEISS makes the precision optics in Germany; imec trials the processes in Belgium.
72%
Of world pure-play foundry revenue attributed to TSMC, Q1 2026
TrendForce / Counterpoint
9%
EU share of the world semiconductor market
European Commission
20%
The 2030 political target the Court of Auditors calls aspirational
European Court of Auditors
Scroll the figure sideways
Foundry concentration, cross-checked
Two independent estimates, reported separately and never aggregated: perimeters and definitions differ.
Source TrendForce; Counterpoint Research
| Company | TrendForce | Counterpoint |
|---|---|---|
| TSMC | 72.3% | 73% |
| Samsung | 6.5% | 7% |
| SMIC | 5.1% | 5% |
CSV: data/core/06_05_foundry_concentration_crosscheck.csv · Download data and sources
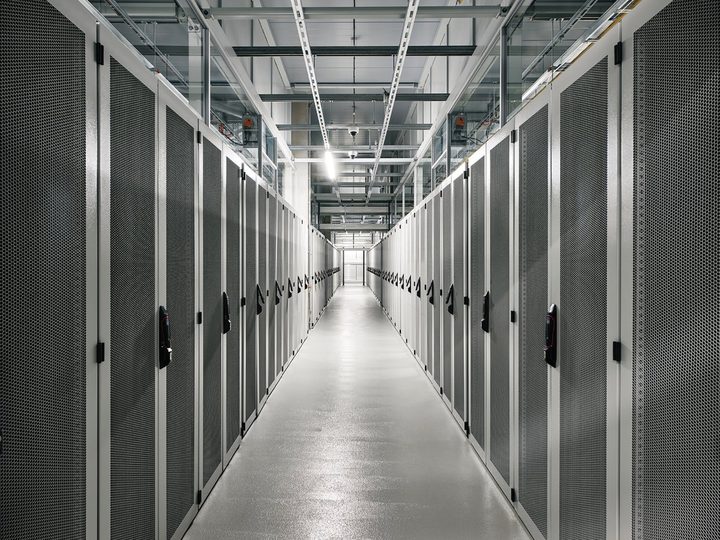
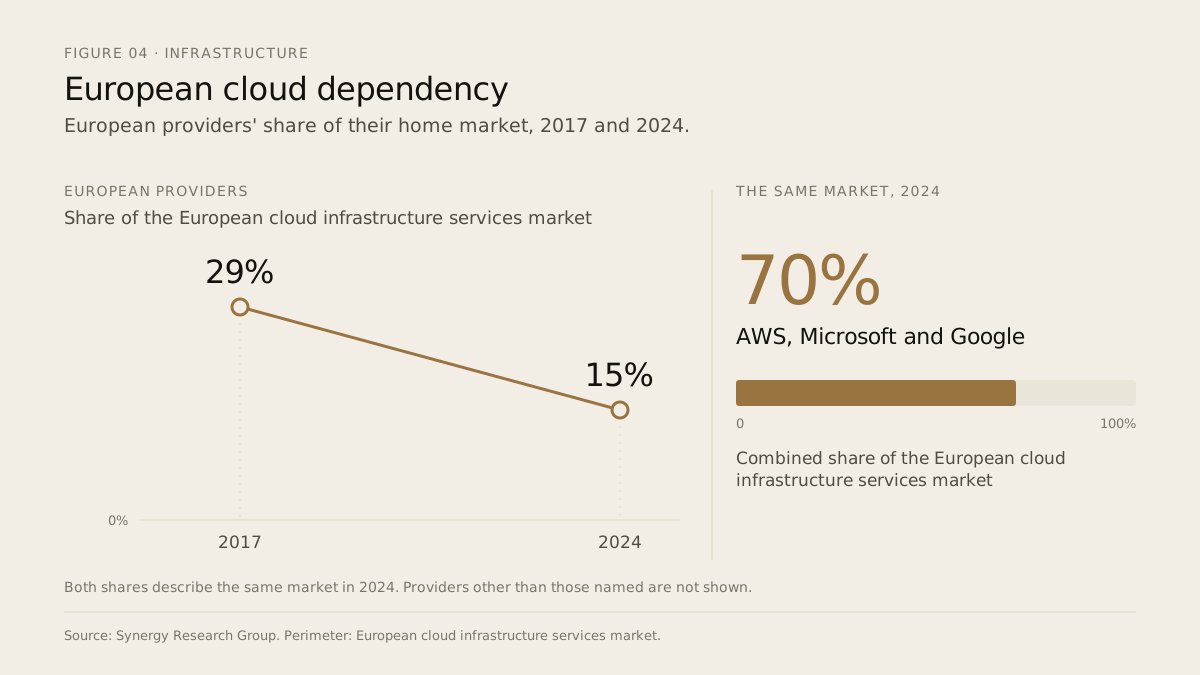
Three groups control roughly two thirds of the world cloud market. European providers held 15% of their own regional market in 2024, down from 29% in 2017.
Market shares vary by perimeter and by source: they must be reported separately, never aggregated.
15%
European providers' share of their own market, 2024
Synergy Research Group
29%
The same share in 2017
Synergy Research Group
70%
Held by AWS, Microsoft and Google in 2024
Synergy Research Group
Scroll the figure sideways
European cloud dependency
Source Synergy Research Group
| Year | European providers | Note |
|---|---|---|
| 2017 | 29% | — |
| 2024 | 15% | AWS, Microsoft and Google together: 70% |
CSV: data/core/05_04_europe_cloud_dependency.csv · Download data and sources
Europe trains some of the best researchers in the world and has credible companies in the layer that connects models to business processes. The weak point is not competence: it is the ability to retain the value that competence generates.
The ELLIS network: 47 sites across 19 countries.
47
ELLIS research sites across 19 countries
ELLIS
1
Generalist lab: Mistral, present in technical comparisons, not yet at the very top
Report ch. 02
$5.9 / 4.4 / 3.9bn
Private AI investment 2025: UK, France, Germany
Stanford AI Index
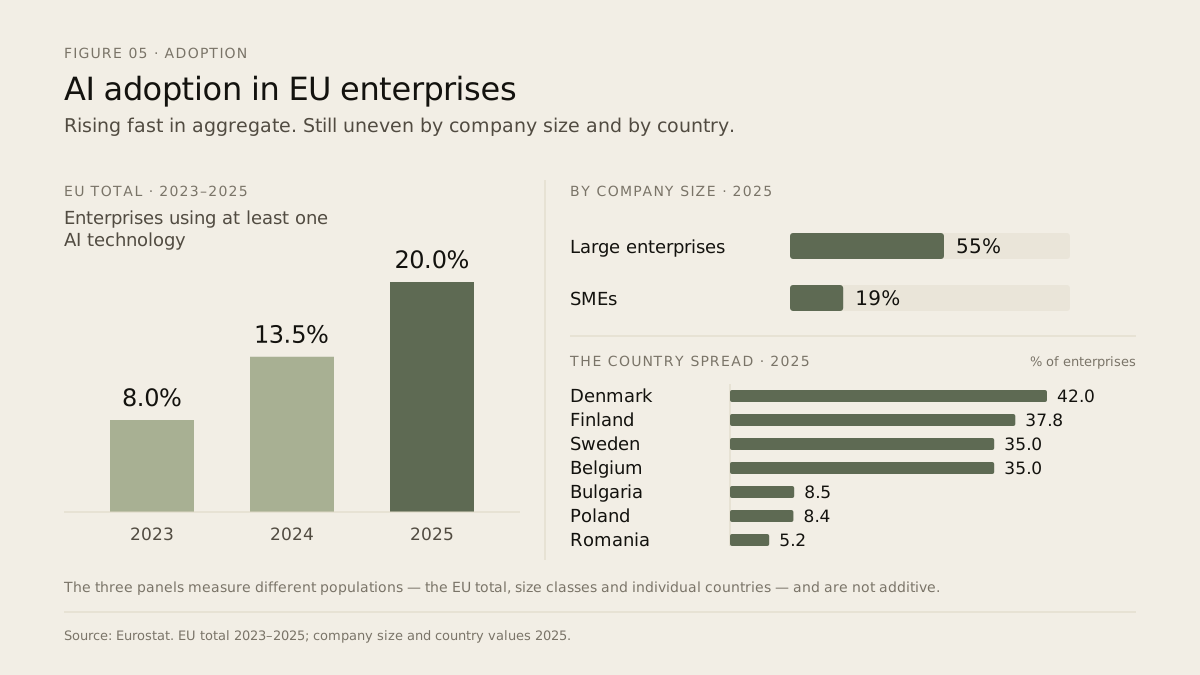
In two years the use of AI in European enterprises has more than doubled: from 8% in 2023 to 20% in 2025. The indicator measures the use of at least one technology. It does not measure the depth of the transformation.
Large enterprises 55%, SMEs 19%. Denmark 42%, Romania 5.2%.
20%
European enterprises using at least one AI technology, 2025
Eurostat
8%
The same figure in 2023
Eurostat
55% vs 19%
Large enterprises versus SMEs
Eurostat
Scroll the figure sideways
AI adoption in EU enterprises
The indicator measures the use of at least one technology. It does not measure the depth of the transformation.
Source Eurostat
| Series | Value |
|---|---|
| 2023 | 8.0% |
| 2024 | 13.5% |
| 2025 | 20.0% |
| Large enterprises (2025) | 55% |
| SMEs (2025) | 19% |
| Denmark | 42.0% |
| Finland | 37.8% |
| Sweden | 35.0% |
| Belgium | 35.0% |
| Bulgaria | 8.5% |
| Poland | 8.4% |
| Romania | 5.2% |
CSV: data/core/01_01_eu_enterprise_ai_adoption.csv · Download data and sources
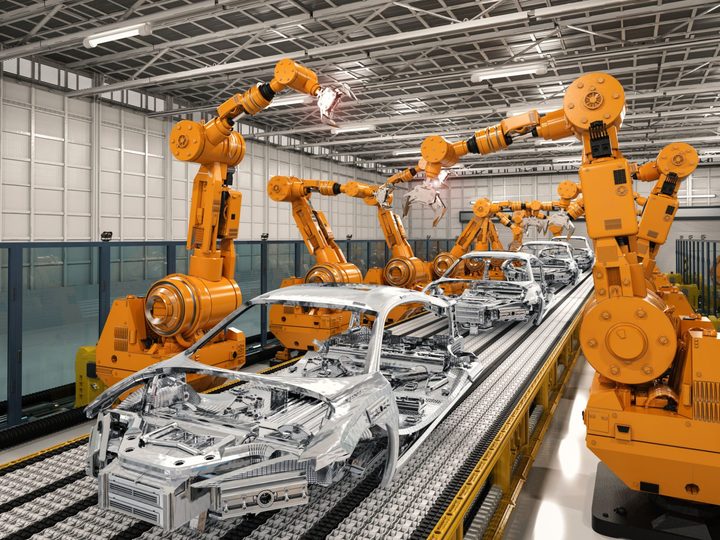
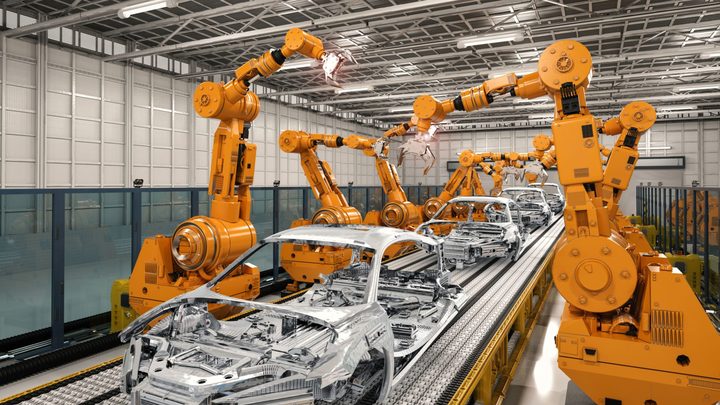
Physical AI means systems where a model does not only produce text or images but controls or guides an object in the physical world: a robot, a vehicle, a production machine, a plant. This is the ground where Europe's industrial base counts for more than the capital available.
European manufacturing generates around 14% of EU GDP and over 30 million jobs.
€2,400bn
Value added by European manufacturing
Eurostat
14%
Of EU GDP
Eurostat
30m+
Jobs in European manufacturing
Eurostat
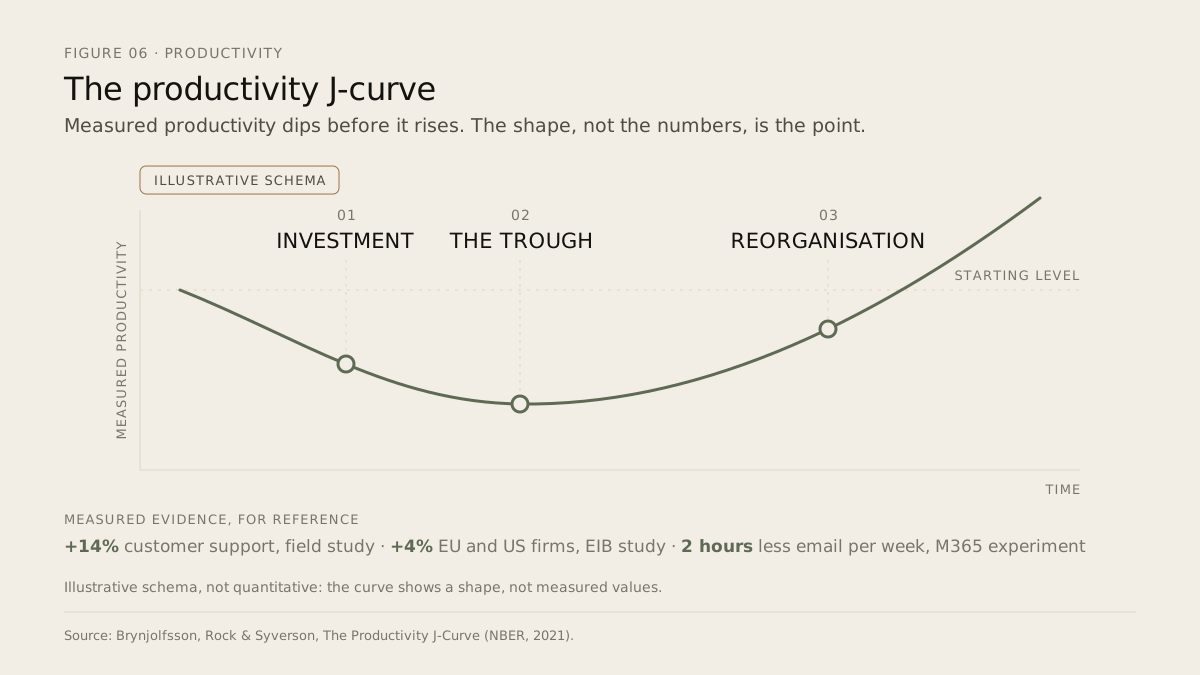
Scroll the figure sideways
The productivity J-curve
Illustrative schema, not a quantitative series: amplitude and duration vary by company and by process.
Source Brynjolfsson, Rock and Syverson, The Productivity J-Curve (NBER, 2021)
| Stage / evidence | Value |
|---|---|
| 01 Investment | Spending precedes measured output |
| 02 The trough | Measured productivity dips while work is reorganised |
| 03 Reorganisation | Gains appear once processes change |
| 01 What it costs | Licences, integrations, training and the time of the best engineers |
| 02 What is at stake | The old process coexists with the new one |
| 03 What changes | Roles, timing and accountability |
CSV: data/core/17_15_productivity_jcurve.csv · Download data and sources
The decisions that matter are not about which model to choose. They are about which processes to redesign now.
Europe in the Age of AI · 2026 edition · Lateral Space
In summary
The machines that print the most advanced chips, the precision optics that make them possible, the processes proven years before production. It is a real position, concentrated in very few organisations.
Specialised chips, high-bandwidth memory, advanced manufacturing, global-scale cloud, frontier models, growth capital. These are not marginal gaps: they are the steps where prices and terms are set.
Manufacturing, energy, engineering, pharmaceuticals, public services: the base is there. Value is decided by who transforms their processes first, not by who owns the best model.
The decisions that matter are not about which model to choose. They are about which processes to redesign now.
Lateral Space, Europe in the Age of AI 2026, Research Edition, 2026. · Found something to correct? Write to hello@lateralspace.ai
Data and figures under CC BY 4.0: free to reuse, including commercially, with credit to Lateral Space. Third-party photographs and the original material of the cited sources are excluded.
Next editions
Get the 2027 edition and new Lateral Space research. The report itself stays free and ungated — this is optional, and it comes after.
For your organisation
The most open part of the value chain is the one where AI enters the processes, the data and the decisions of an organisation. A thirty-minute briefing to translate the report into your company's context.
Request a briefing